Bridging Physical and Digital Worlds: When Your Body Is Your Tool, Data Becomes Accessible
New interaction models developed at University of Maryland and University of Manitoba utilize body and hand movement to perform data analysis on large wall-sized displays.
By Sriram Karthik Badam, Fereshteh Amini, Niklas Elmqvist, and Pourang Irani
Large displays are becoming common in modern offices as presentation spaces for meetings and analytical spaces to help people understand business performance for decision making. Such large displays are ideal for groups of people to collaborate and solve problems together. This is possible due to the physical space in front of a large display that naturally invites collaboration compared to a small personal computer. Figure 1 shows such a place where analysts are observing temperature, moisture, and humidity over time for an office building by watching and discussing the information visualized on a wall-sized display to identify air conditioning issues.
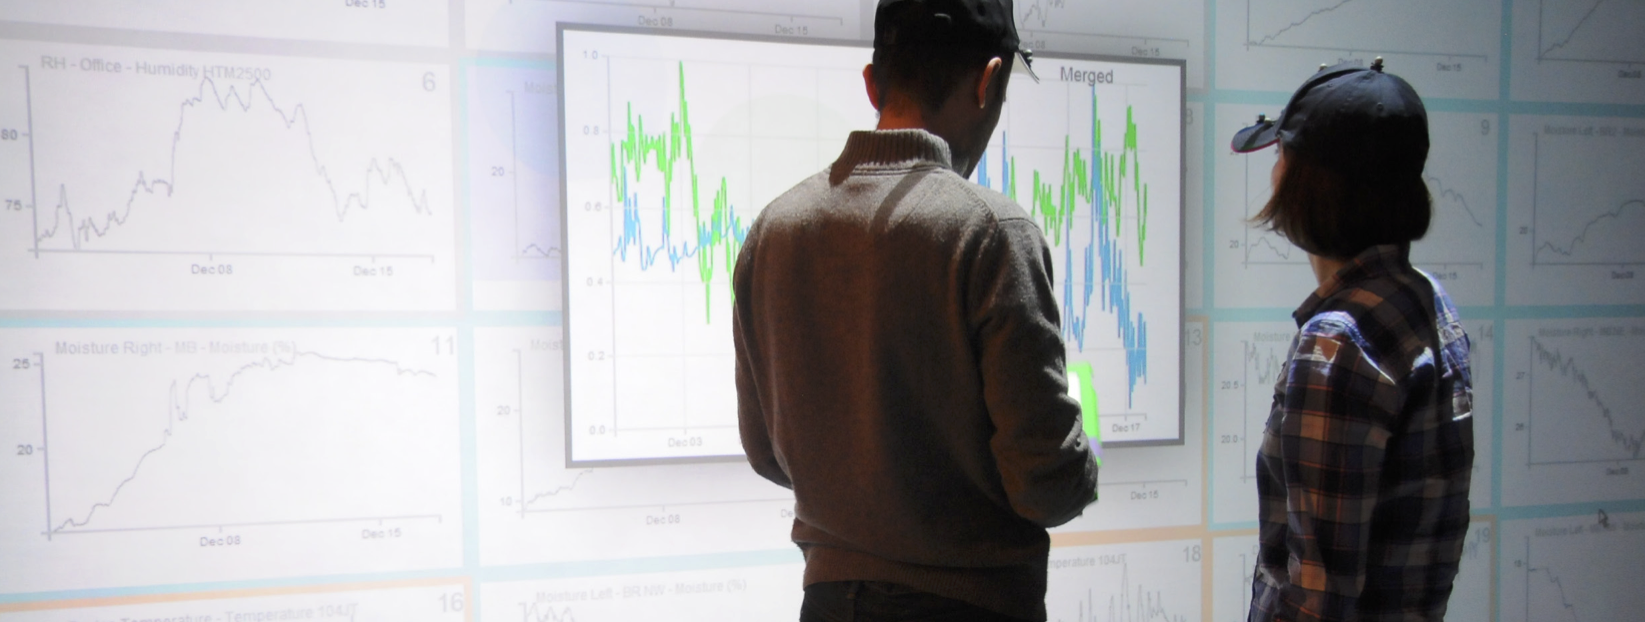
Figure 1: Two analysts observing temperature, moisture, and humidity over time for an office building and discussing the information visualized on a wall-sized display to identify air conditioning issues.
The major challenge for these advanced office environments is the input mechanism that bridges the physical and digital worlds. Commonly we use mouse, keyboard, and touch for our personal computers, but such inputs are a poor fit for a large wall-sized display. Interacting with your body, like how we do in the real world, is more advantageous in such environments. In a research paper published at the prestigious IEEE VAST conference, we designed and evaluated interactions with data on a large display based on body movement, body orientation, and even hand gestures—thus turning your body into a tool to access data on a display.
Interaction with Large Displays: Should it be Implicit or Explicit?
Traditionally, interaction with a device is done through an explicit physical action—e.g., opening an application with a mouse click, selecting photos just by touching a phone, or writing a text with a keyboard. In contrast, interaction with the whole body can be subtle and implicit. For example, lights can be turned on in a room merely by entering the room. With such an interaction, the person did not have to perform a specific action such as turning on a light switch. Implicit interactions based on full body actions thus promise less effort for the same activity. However, as one can imagine, it is challenging to design such interactions for complex tasks beyond turning on a light. Therefore the research question of which interactions are better for what tasks is yet to be answered.
Our paper introduces these two interaction models—implicit based on the human body actions and explicit based on hand movements (gestures)—for multiple users performing data analysis tasks. For this, we developed a computer interface where data is shown in charts on a large display and multiple users can analyze these charts through “lenses” that show part of the data.
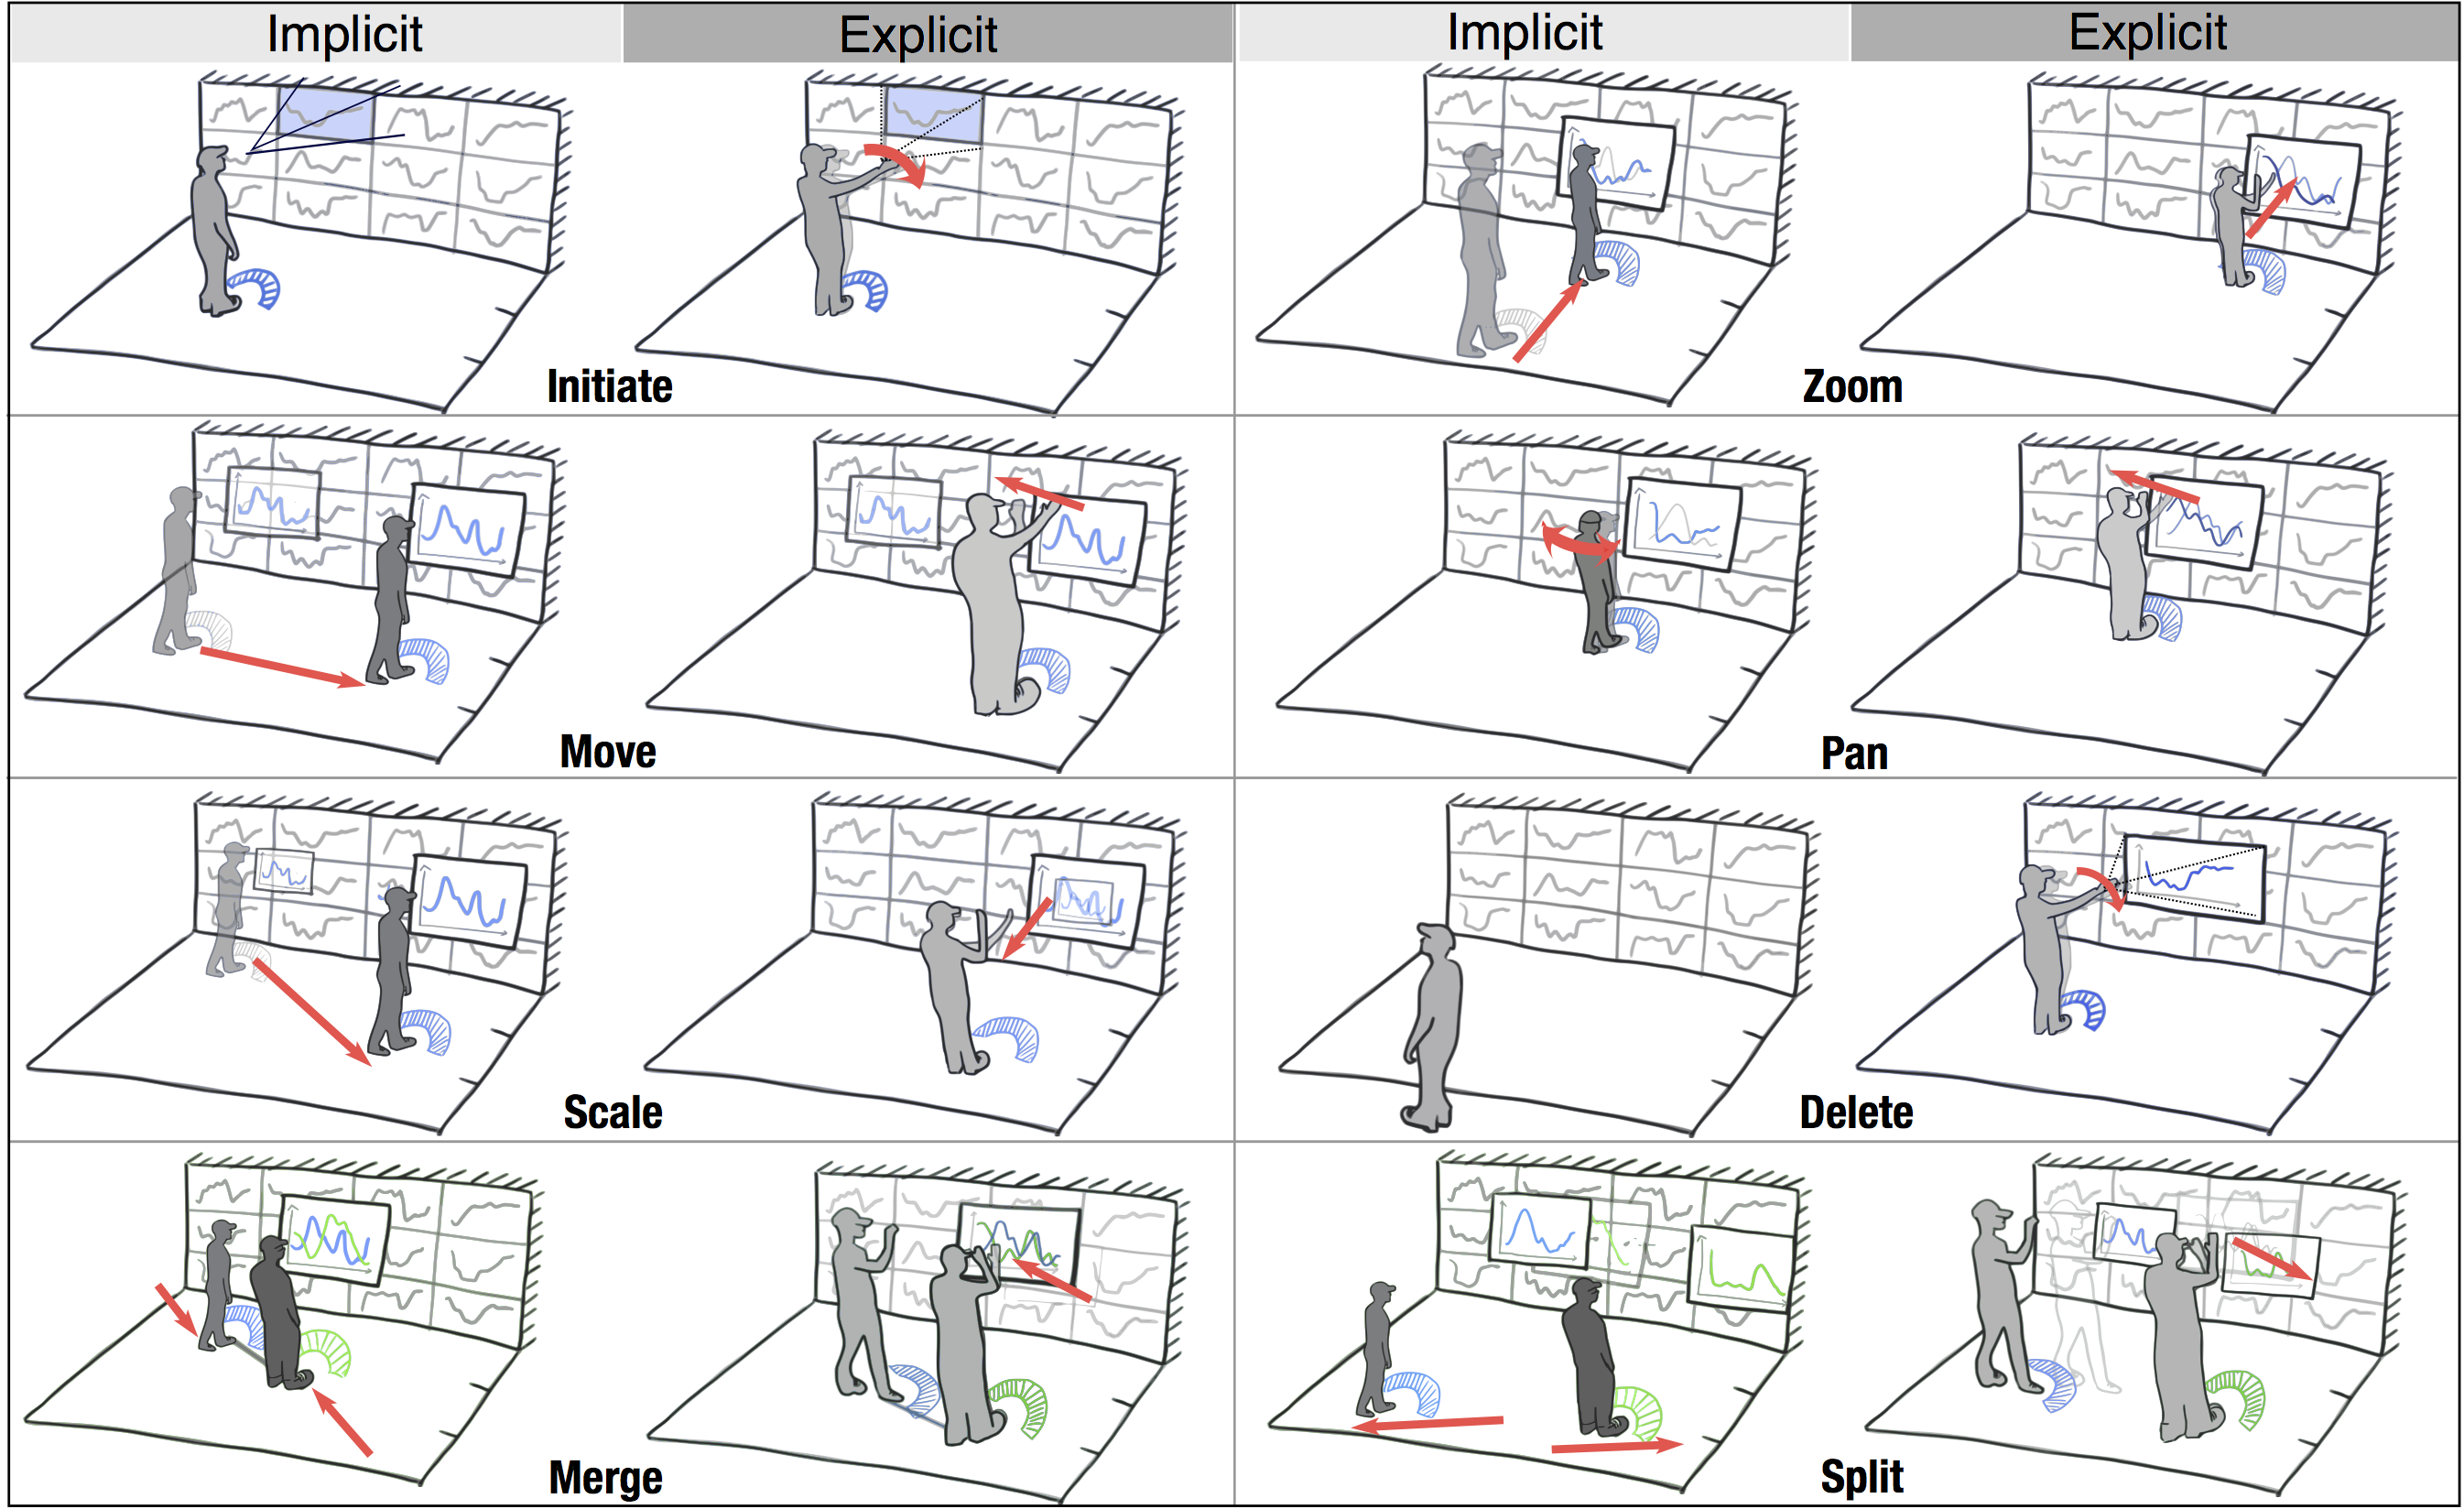
Figure 2: Data analysis tasks and their associated implicit and explicit interaction alternatives. Implicit interactions are based on full body movement, while the explicit interactions are based on hand gestures.
Creating the Best Model for Interaction with Data
As seen in Figure 2, we identified eight types of data analysis tasks and developed implicit and explicit interaction alternatives for each. We evaluated the performance of these interactions using student volunteers in a laboratory study. Participants used both interaction models to understand patterns, trends, and anomalies in a dataset. Overall, two major findings emerged,
- Implicit interactions were natural and useful when they are used to subtly adjust the personal content of each user to their position in the physical space (e.g., increasing size of a chart based when the user is far away or combining charts when users are close to each other),
- Explicit interactions were convenient and suitable for completely manipulating the personal content (e.g., showing more information on a chart or removing the chart altogether).
Based on these findings, we combined both implicit and explicit interactions to create a hybrid model for data analysis on a large display. For a video demo of this model, we refer to this link.
Better Support for Data Analysis
We evaluated the usability of our hybrid interaction model through another laboratory study involving data analysis. This revealed the following:
- Participants almost did not perceive the implicit actions (e.g., personal content following the user in the space). These interactions were seamless as they do not require training or any extra effort in the physical space.
- Participants saw the explicit interactions as very accurate and intuitive in most cases.
- Participants took advantage of the hybrid model to come up with multiple ways to collaborate with others—some would place themselves close to their partners so that they are implicitly recognized as a group and could interact together, and others would explicitly decide what their partners should do and only combine their work at a certain point in the data analysis.
The Future of Data Analysis: Natural Interaction and Immersion
The future of displays and interaction spaces consists no longer of just a single person sitting in front of a desktop computer. We are now seeing a surge in augmented reality—adding to the visual space of users through head-mounted transparent displays and virtual reality—immersing users in a digital space. The findings from our research suggest that we should balance implicit and explicit body-based interaction to not only adapt to these new display technologies but also efficiently use them for data analysis.
More Information
This paper is accepted for publication at the IEEE VAST conference. Here is the citation:
Sriram Karthik Badam, Fereshteh Amini, Niklas Elmqvist, Pourang Irani. Supporting Visual Exploration for Multiple Users in Large Display Environments. In Proceedings of the IEEE Conference on Visual Analytics Science and Technology (VAST), accepted for publication, 2016.
Additional resources:
- Paper: https://www.dropbox.com/s/f8bnurb80n1a322/multiuser-vis.pdf?dl=0
- Video Demo: https://www.youtube.com/watch?v=xd7G_q8nocc
Visualization research at the HCIL has a long and proud history, going back to the founding of the lab in 1983. Today, visualization researchers at the HCIL conducts research in information visualization, visual analytics, and data science. Sriram Karthik Badam is a Ph.D. student in Computer Science at University of Maryland, College Park and a member of the HCIL. Niklas Elmqvist is an associate professor of information studies at the University of Maryland, College Park and a member of the HCIL. This work is done in collaboration with Fereshteh Amini and Pourang Irani at University of Manitoba in Winnipeg, Manitoba, Canada.