The Diversity of Data and Tasks in Event Analytics
Web companion page of the VIS2016 Event Event Workshop paper:
The Diversity of Data and Tasks in Event Analytics
Catherine Plaisant, Ben Shneiderman
Proceedings of the IEEE VIS 2016 Workshop on Temporal & Sequential Event Analysis.
Available online at: http://eventevent.github.io
Your feedback is welcome. Contact plaisant@cs.umd.edu
Updates:
- October 17, 2016: 1st posting. The list are unchanged from the paper, but will be updated as you provide feedback.
- December 7, 2016: Added figures and the link to the slides.
Data Diversity
Event data can be described as consisting of one or more collections of records, each made of a set of timestamped event categories (sometimes called names or types) such as an admission to the hospital, a webpage visit, or a phone call. Still, temporal datasets following this simple description may differ in many ways.
Unless otherwise specified all examples are from our EventFlow case studies.
Temporal characteristics may vary:
- Records may include point events only (e.g. buying a product), interval events (e.g. taking a medication for three weeks, commonly recorded with a start and end timestamp) or a mix of both.

Point events Interval Events - Records may include many events recorded simultaneously with the same exact timestamp, e.g. student records show all classes taken in a semester as having the same time stamp, medical data are often recorded in batches after the fact
- The relevant time scale may vary (from milliseconds to years), and may be homogeneous or not
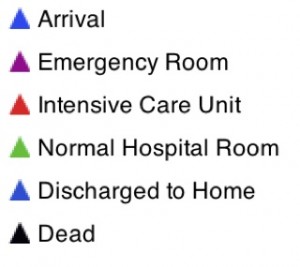
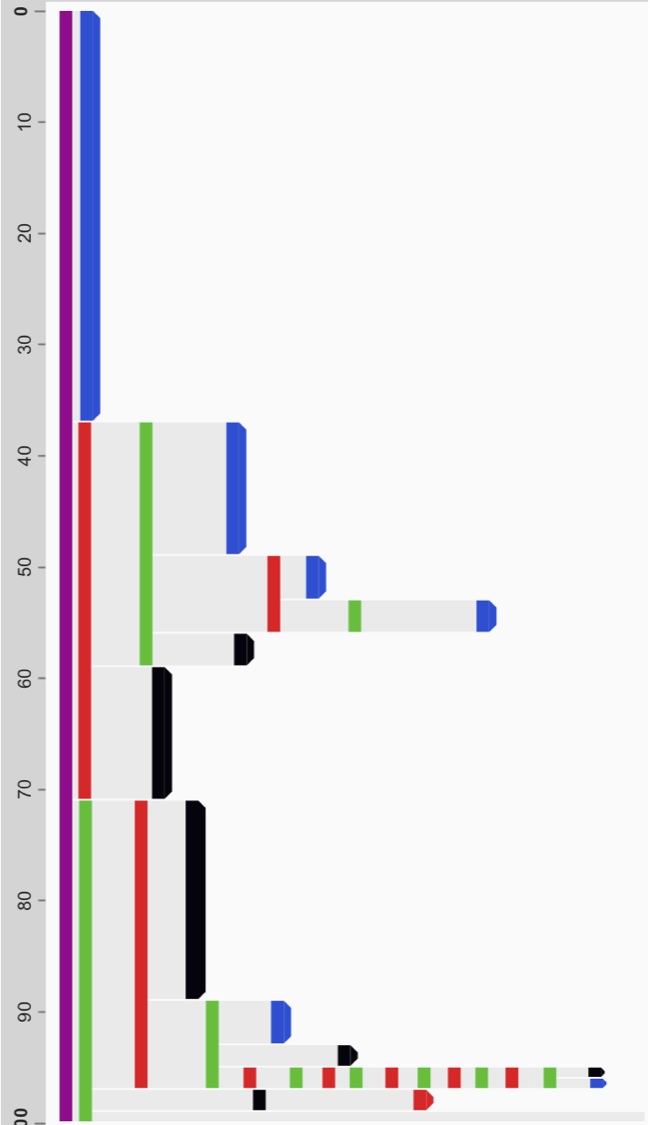
- Data may represent changes over time of a status indicator

e.g. changes of cancer stages, student status or physical presence in various hospital services, or may represent a set of events or actions that are not exclusive from one another, e.g. actions in a computer log or series of symptoms and medical tests.

- Patterns may be very cyclical or not, and this may vary over time.
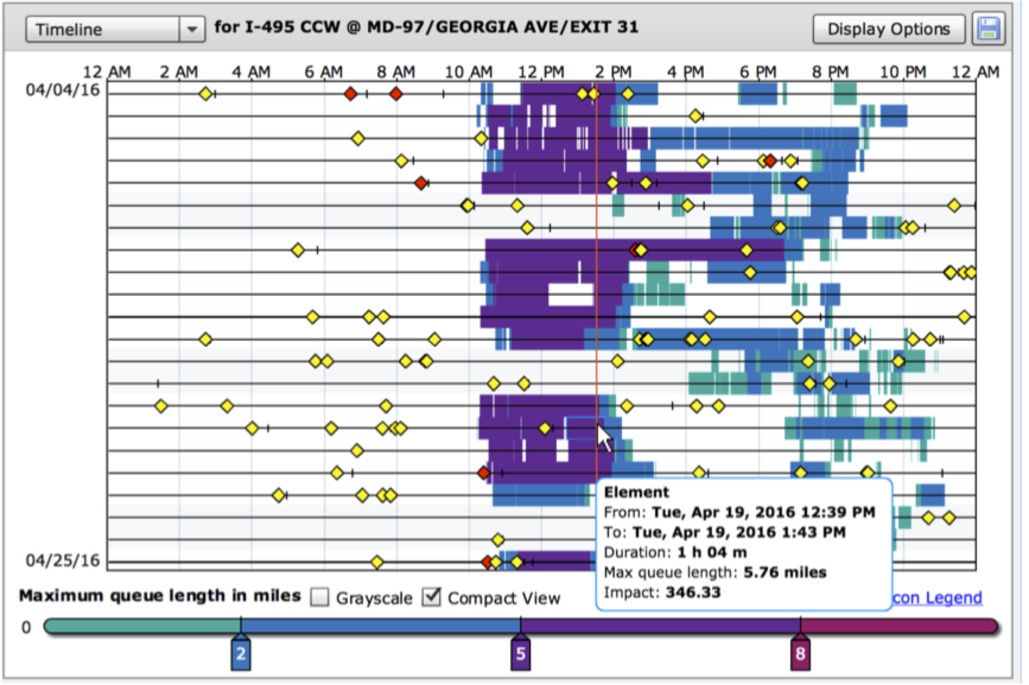
e.g. a spiral and day view or highway incidents and congestion over several days: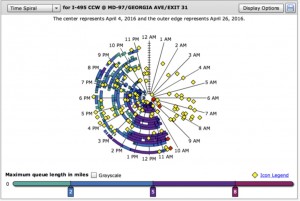

(From the CATT lab: www.cattlab.umd.edu) - Events may be recorded in a continuous stream, at fixed intervals or random intervals. The data may lead to extremely long records with thousands of events, e.g. web logs, stock market trades, blood oxygen reports.
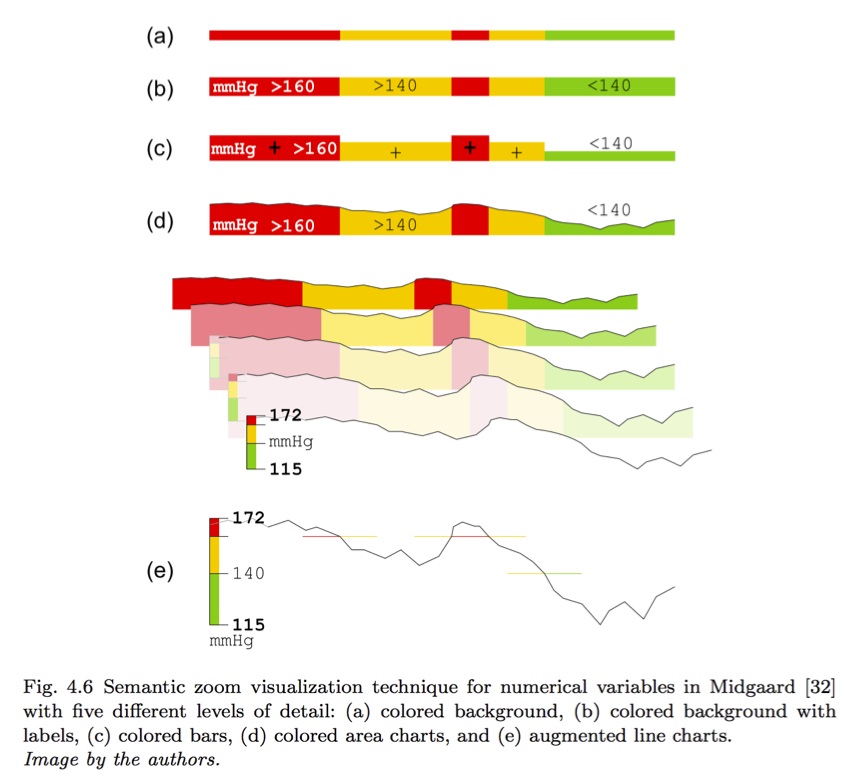
- Categorical events may have been generated from numerical data and need to be linked back to their source (e.g. an abnormal heart rate event to a specific original reading or to the corresponding time series). Still the bulk of event analytics data do not come from numerical time series (i.e. from data that was captured at regular time intervals, which can then be “eventized”, e.g. Gregory and Shneiderman, 2012). Event data tend to reflect “natural” activities (usually human activities) that could happen anytime and are not on a set schedule, opposed to time series data which tend to be captured automatically or according to a set schedule.

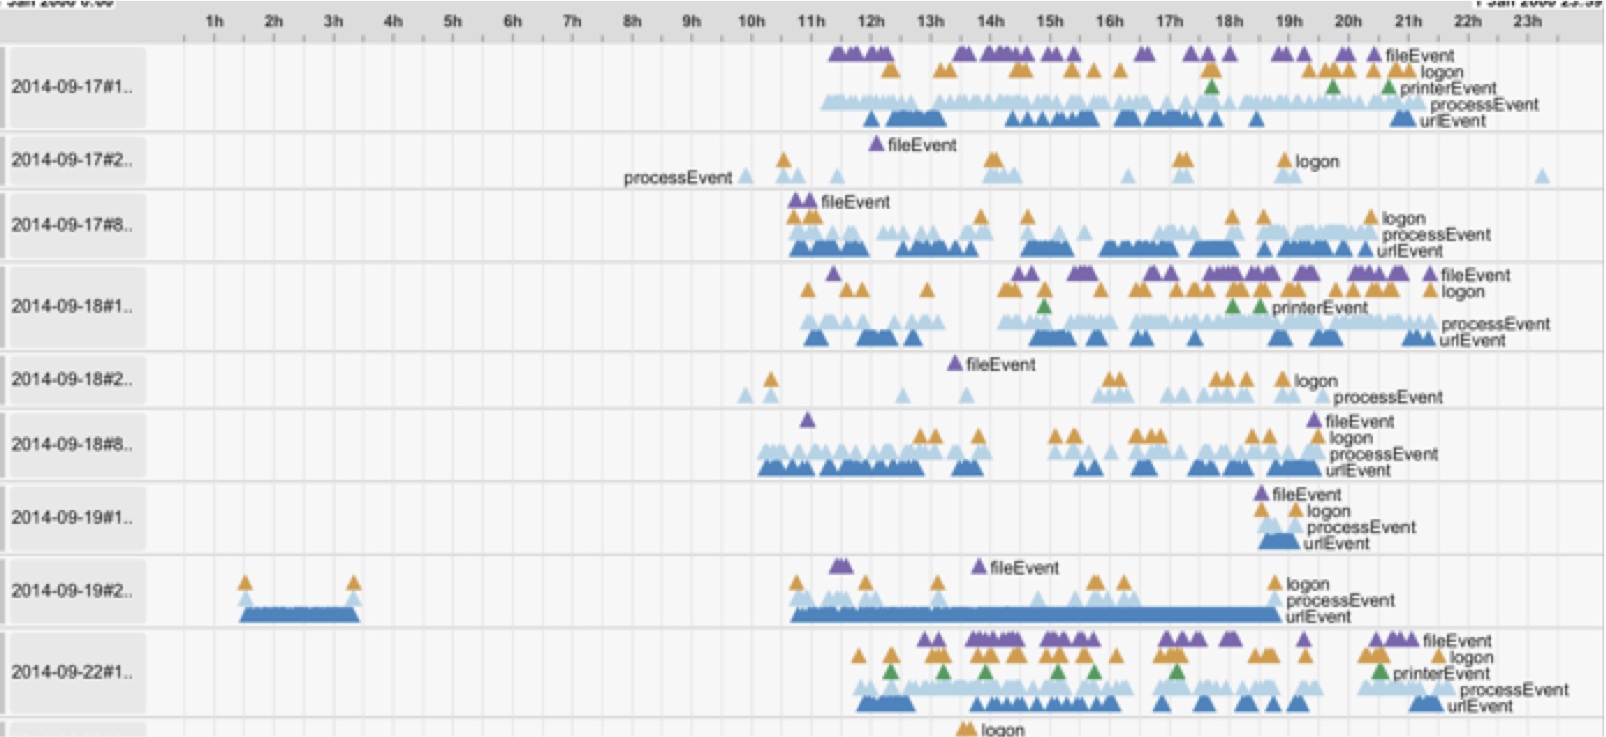
- The time information may be absolute (allowing or requiring the use of calendars and knowledge of day and night, days of the week or holidays) or may be recorded – or better analyzed – as relative time data.
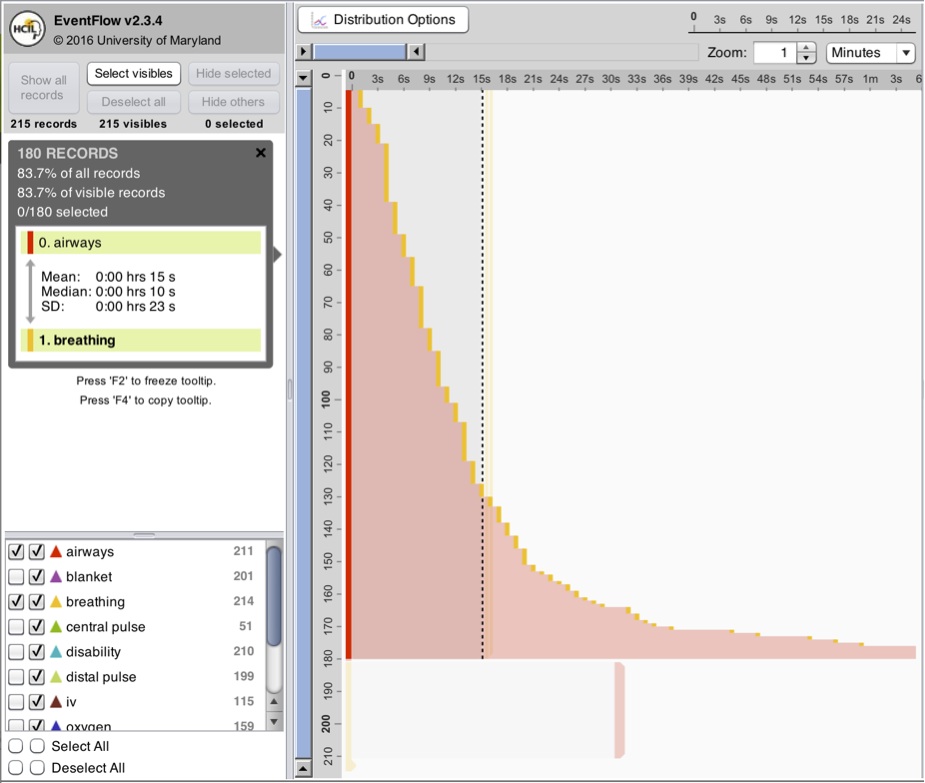
Absolute time (reveals abnormal events at night) Relative (shows before and after green event) - The time duration between events may be important or not.Below we can see that it takes twice as long to go from red to yellow than to go from yellow to red. Statistics may be enough, but details like distributions help.

Timing may not be important or not available at all, providing sequence-only information.
Sequence only: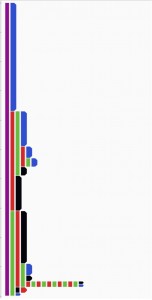 Compared to sequence + timing:
- Attributes may be available or not:
- Record attributes, e.g. age or gender of a person.
- Event attributes, e.g. the name of the physician who ordered a test, or the product being bought. Attribute data can be complex, e.g. an interval event such as a prescription for Drug A can have attributes for “orally,” “3 times a day,” and with “dosage less than 500mg per intake”. That detail information may only need to be available for viewing, or may become an essential part of the temporal analysis.


Outcome information is often encoded by the presence or absence of a particular event category (e.g. a purchase event, or a cancer recurrence) but may also be encoded as an event attribute. Levels of uncertainty or the source of the data may be recorded as attributes as well.
Scale may vary widely in terms of:
- Number of records (from a handful a few to billions).
- Number of events per record (from a few to tens of thousands).
- Number of event categories (from a handful to thousands). An important characteristic is whether there exists a hierarchical organization of the event categories or not. For example, drugs such as “gentamicin” “tobramycin” or “vancomycin” can be rolled up to “antibiotic” or even “aminoglycoside” using a drug ontology. Even when aggregation is possible dynamic access to original categories – and their attributes – may be needed during the analysis.
Events organized in a hierarchy - Number of unique sequences. This may be expanded to include full record sequences, consecutive sequences of length N, or non-consecutive sequences, and may handle simultaneous events in various ways.
- Number of attributes and attribute values (record and event attributes).
- Proportion and number of events that occur simultaneously (from rare and few at once to widespread and many at once).
- Amount of repetition. Within a single record events of the same type may occur only a few time each or be repeated endlessly (which can be seen as simply the byproduct of large number of events per records and limited number of event categories).
Large datasets tend to be extremely chaotic and combinations of the numbers above may reflect that “chaotic-ness”, but there are also many exceptions where it is possible to aggregate the data and provide simple visualizations of very large numbers of records (e.g. when records have very few events, or when records track status information and the status can only take a limited number of values). Alternatively some modeling and pre-processing of the data will be needed before visualizing the patterns (see T4 below).
TASK DIVERSITY
Here we propose a set of high level tasks, which is based on our own experience working with dozens of experts in various application domains. This list will grow with the field as new applications emerge. Tasks also vary greatly, making different techniques more or less effective for a given task – or more likely for a given [task + data characteristics] combination.
Heighten awareness:
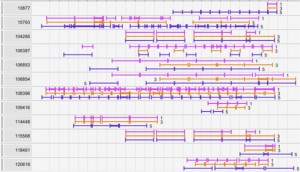
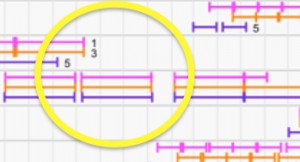
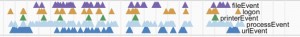
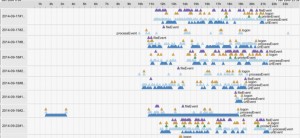
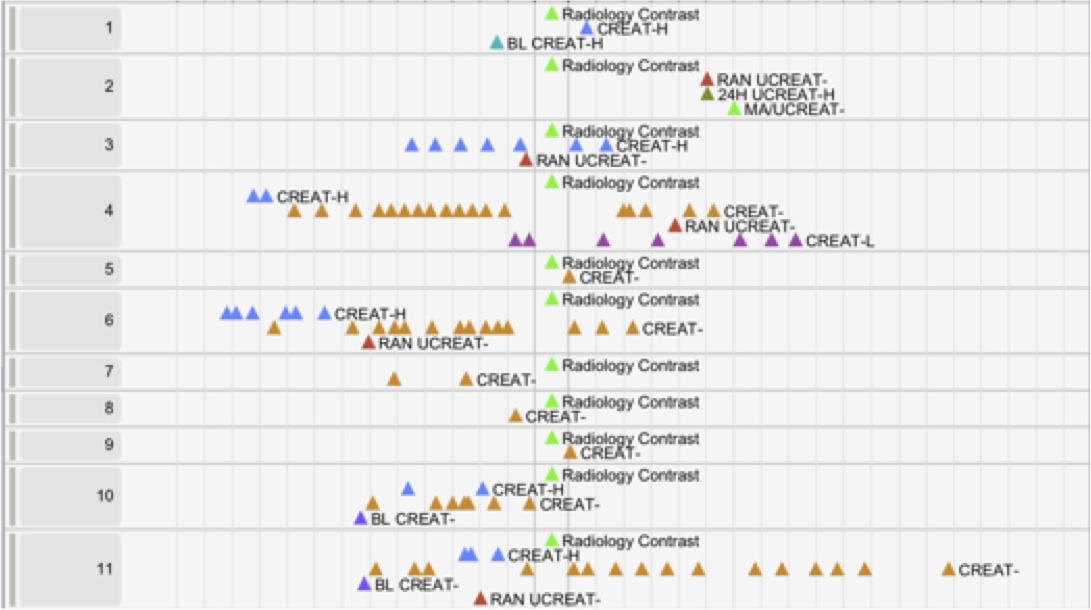
- T1: Review in detail a few records. When the number of records is small a convenient way to view all the details may be all that is needed. There may be a single record (Plaisant et al. 1998; Zhao et al. 2012; Gregg, 2016), or just a few records, e.g. for periodic progress review of a small medical study. The timeline view of the tool EventFlow (hcil.umd.edu/eventflow) has been used often for that task, and is best viewed on a very high resolution display (>8K pixels wide). Users may also need to review or validate the results of an analytic algorithm, e.g. the 10 most suspicious activity records based on anomaly detection), or focus on 3 medical records that may be duplicates – in which case the goal becomes to reveal similarities and differences.
- T2. Compile descriptive information about the dataset or a subgroup of records and events. Descriptive analytics answers questions that are fairly vague to start with, e.g. “what happens to our patients after they leave the emergency room?” or “What are the common patterns of use of this software?”. It is exploratory and typically leads to a large number of views of the data. Aggregated views are useful (Wongsuphasawat et al, 2010, Wongsuphasawat et al. 2012a; Perer et al., 2015). Interaction allows users to see progressively more complex combinations: individual event category, pairs of categories, 3, 4, etc. General tools like EventFlow allow users to combine search, alignment, ranking, time windowing and sequence pattern overviews and provide potent custom visualizations to skilled users, but when carefully user needs analysis has identified needed summaries, they can be generated automatically, and even simple bar charts of event counts may be sufficient (Zgraggen et al. 2015).
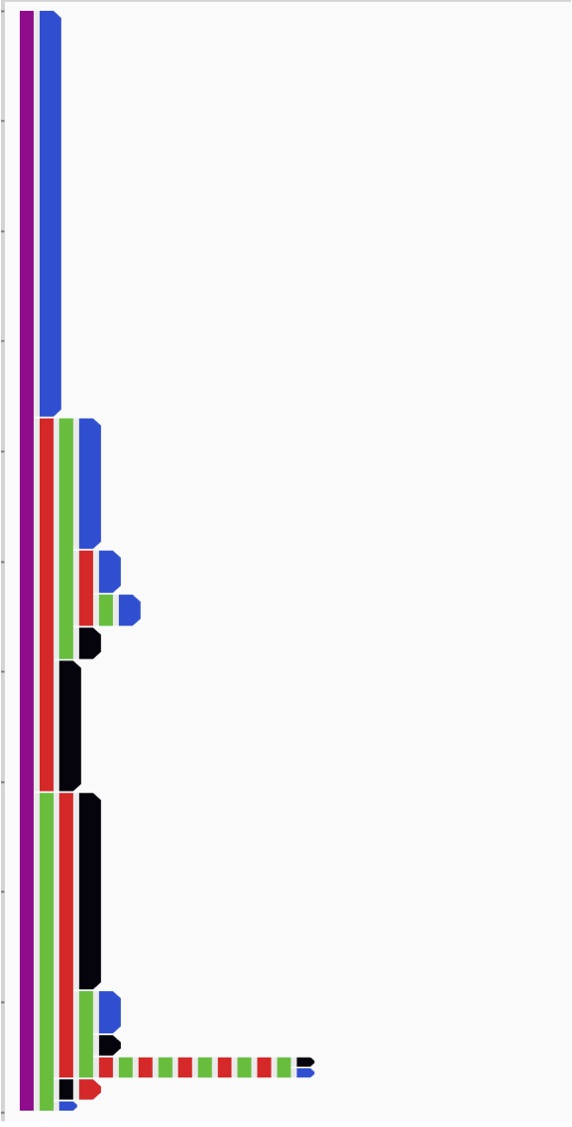
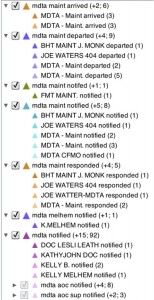
- T3. Find and describe deviations from required or expected patterns. The research question might be: Are doctors prescribing asthma medication according to FDA guidelines? (Plaisant et al. 2014). Are doctors following the mandatory workflow for emergency patients entering the trauma bay?
Below we see the expected sequence (used less than 1/2 of the time)at the top,
and below it the 24 variations + their prevalences.
Another example question is: Are doctors really diagnosing and treating giardia according to established protocols? (Beer et al. 2016). Users may be able to use a series of searches to find the % of records that follow the expected pattern(s) (see T5 below) but it is a lot more challenging to explore and report on the type and prevalence of the wide variations usually found in the data (T2).
Prepare or select data for further study:
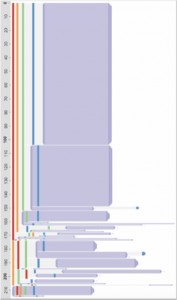
- T4. Review data quality and inform choices to be made in order to model the data. Visualization invariably reveals data quality issues and event analytics is no exception (Gschwandtner et al, 2011; Gschwandtner et al. 2014). In the case of event analytics, the data cleaning phase is typically followed by a data simplification (or focusing) phase, with potentially complex data transformations (Du et al., 2016). This task is needed to allow statistical analysis or further visual analysis to answer specific questions. It may include selecting milestone events in a stream, or merging short intervals of the same category into longer interval of treatment. Deciding on the level of aggregation of event categories, e.g. multiple drugs into drug classes, and how much low level information to retain is challenging. Recording those transformations enables analysts to understand and repeat the process they used before uncovering useful patterns, e.g. with T2, or running separate statistical analysis.
Before (confetti):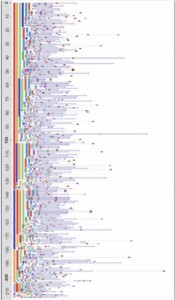 After (revealing clear patterns):
Example of Search and Replace used to simplify the data: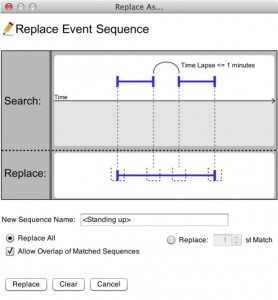
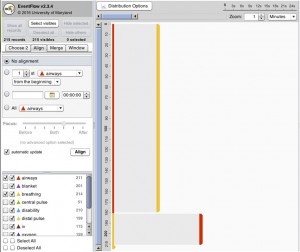
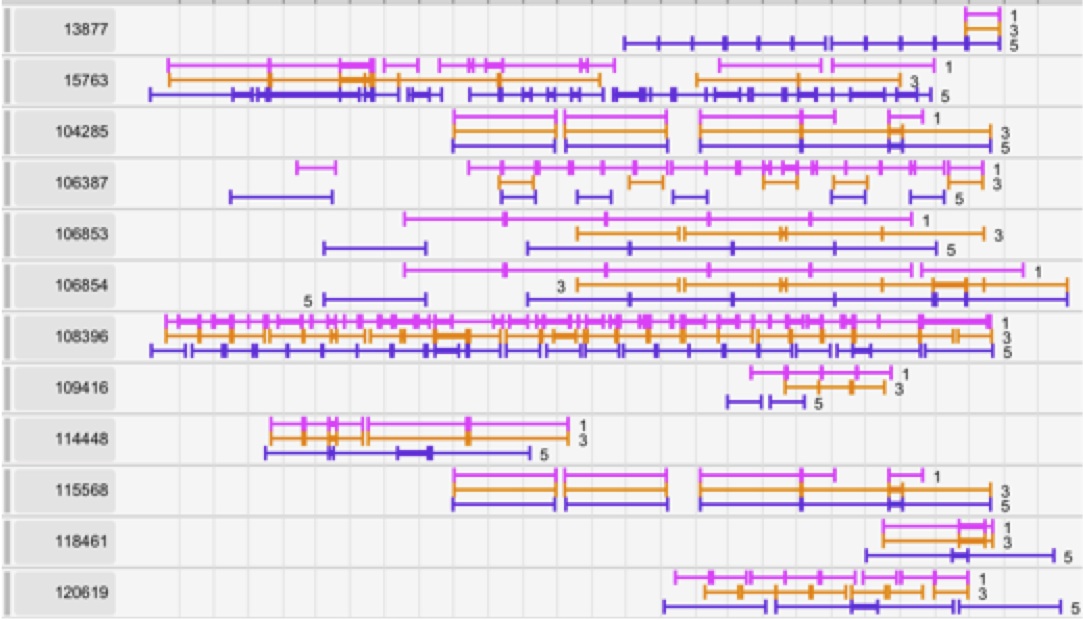
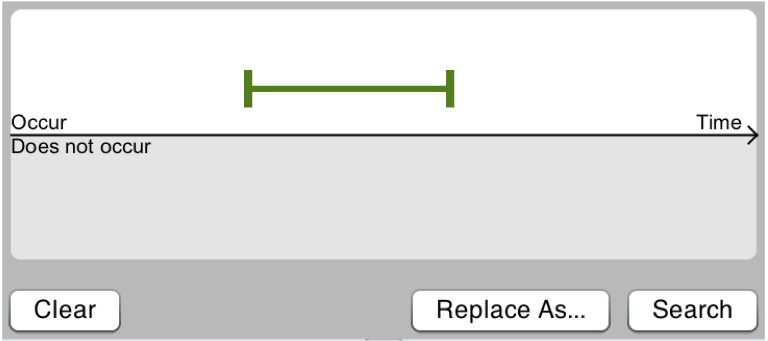
- T5. Identify a set of records of interest. The task may be to identify patients for a clinical trial, customers for an advertising campaign, or students for an intervention. The selection process is often iterative and uses filters on record or event attributes, search for one or more temporal patterns (Jin and Szekely, 2010; Monroe et al., 2013; Zgraggen et al. 2015), but also aggregate characteristics of the set itself such as gender or age balance (Krause et al, 2016). The search patterns may consist of simple sequences or very complex patterns including the absence of events, temporal constraints and filters on event attributes. Specifying complex queries is very difficult so graphical search user interfaces are helpful, but providing a means for users to visually verify that the specified queries corresponds to their intended search is just as critical (Plaisant et al. 2014). The task may also be to find records similar to one or more records of interest, e.g. searching similar patients to review their treatments and outcomes, or similar students to inform academic planning (Wongsuphasawat et al. 2012b; Vrotsou et al. 2013).Here is a example of series of searches:
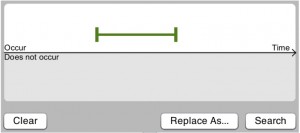 Search records with a green event
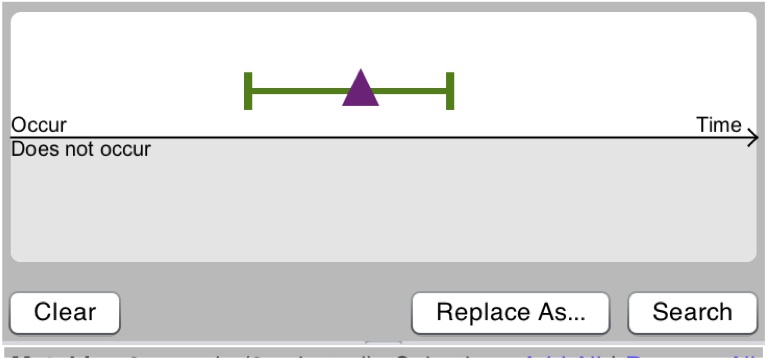
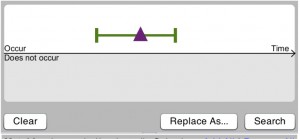 With purple during green
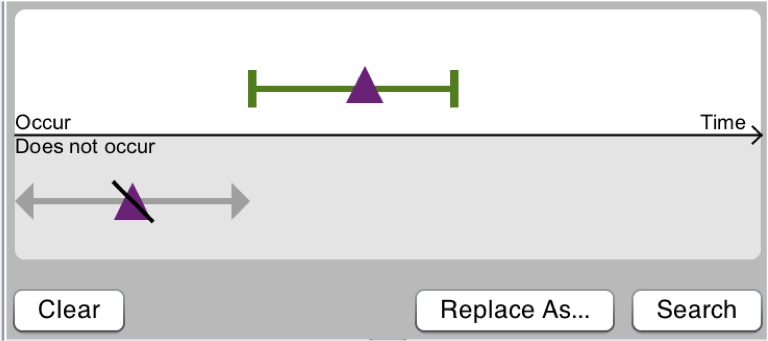
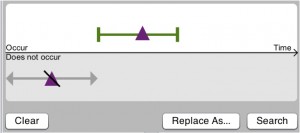 but not purple before green
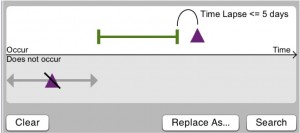 also search for cases where purple occurs soon after green

Understanding impact of event patterns; plan action:
- T6. Compare two or more sets of records. For any dataset there are many comparisons which can be made. The comparison may be made after splitting the data by attribute, (e.g. comparing men and women, patients treated with drug A or drug B, students who change advisors versus those who do not, customers who call help often versus those that do not) or by time period (e.g. this year versus last year or before a change of policy versus after the policy has been put in place) or by splitting by outcome (those who lived versus those who died) or by the presence of a temporal pattern or its absence. The comparison can range from simple statistics to highvolume hypothesis testing in a systematic exploration of event sequence comparisons (Malik et al., 2016).
- T7. Study antecedents or sequelae of an event of interest. This is a common question: what happens after X or before it?” where X is an event (or a specific pattern identified with T5), and descriptive analytics are needed to characterize the preceding and following events, typically within a limited window of time. Results may consist of simple counts of events or barcharts, or more complex descriptive information of the patterns. This task can be seen as a subset of T2 (and sometimes T6 when before and after are compared), but its importance encourages us to give it its own entry in the list.
- T8. Generate recommendations on actions to take. The identification of events correlated to an outcome of interest (Gotz and Stavropoulos, 2014) might guide the analyst exploration and lead to suggestions for refined queries (T5). More ambitiously, prescriptive event analytics may one day allow users to answer questions about what sequence of actions should be taken to increase the chance of reaching a desired outcome (Du et al. 2016), leading to individualized recommendations of effective academic study programs, medical treatment plans or marketing campaigns. Future work might also expand and contrast this high level task characterization with related taxonomies such as the ones for time series analysis (Aigner et al. 2011; Perin et al, 2014) or spatio-temporal analysis (Andrienko et al, 2010). We hope this description of the diversity of data and tasks encountered in event analytics will be useful and look forward to the feedback of our colleagues during the workshop. Task and data diversity is also discussed in another paper of the workshop (Fisher et al. 2016).